Load Board Rate Accuracy: Posted vs Paid Rates (2026)
KEY TAKEAWAYS
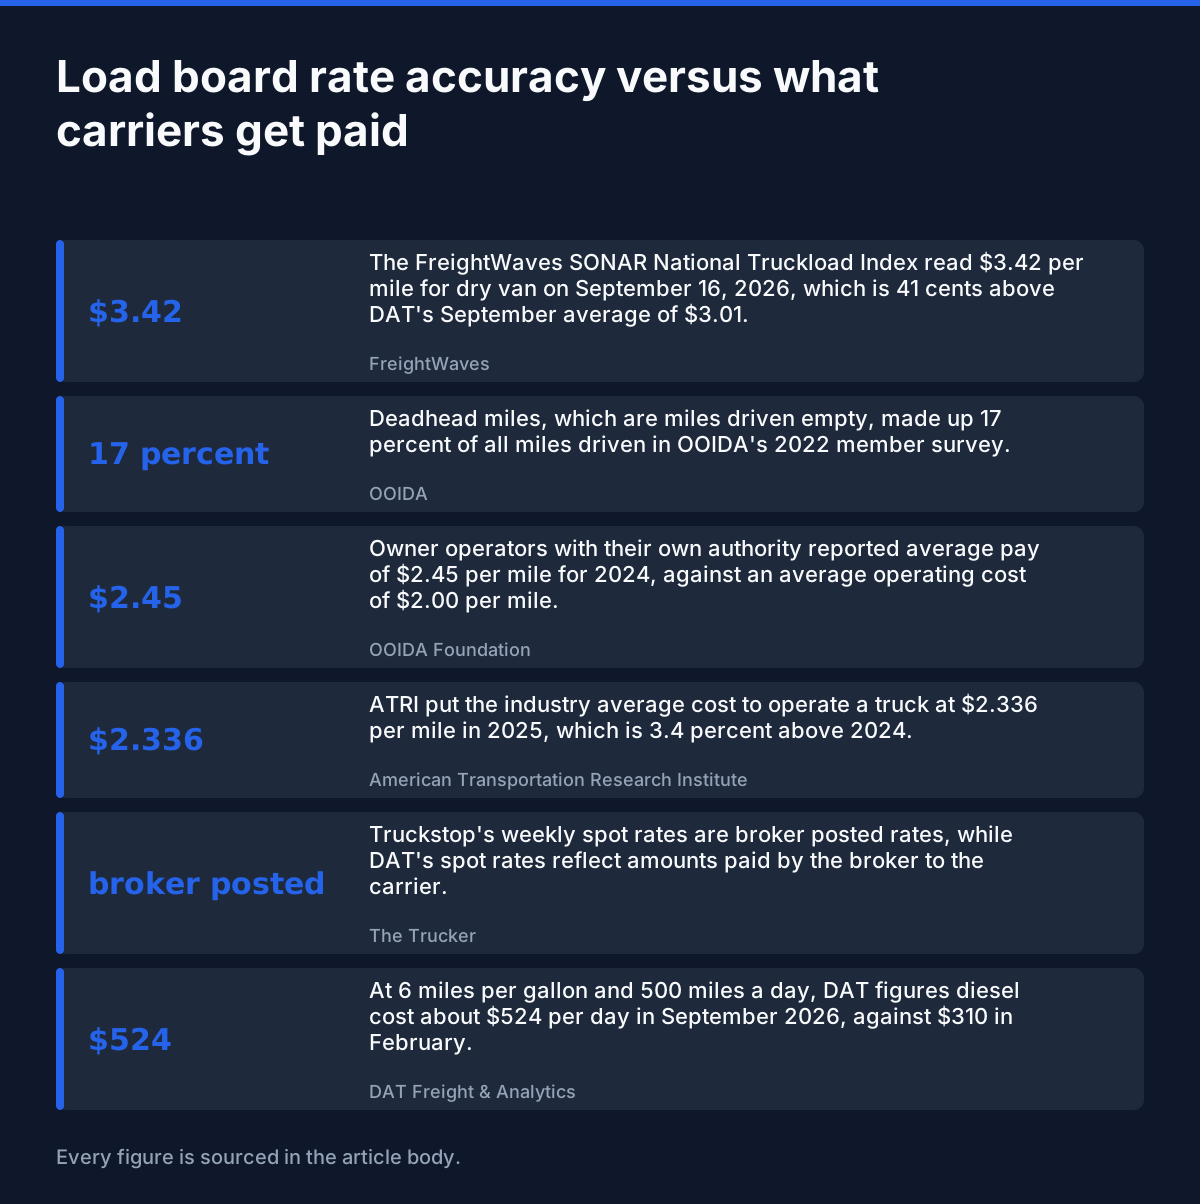
- → $3.42 The FreightWaves SONAR National Truckload Index read $3.42 per mile for dry van on September 16, 2026, which is 41 cents above DAT's September average of $3.01. (FreightWaves, 2026)
- → 17 percent Deadhead miles, which are miles driven empty, made up 17 percent of all miles driven in OOIDA's 2022 member survey. (OOIDA, 2022)
- → $2.45 Owner operators with their own authority reported average pay of $2.45 per mile for 2024, against an average operating cost of $2.00 per mile. (OOIDA Foundation, 2024)
- → $2.336 ATRI put the industry average cost to operate a truck at $2.336 per mile in 2025, which is 3.4 percent above 2024. (American Transportation Research Institute, 2025)
- → broker posted Truckstop's weekly spot rates are broker posted rates, while DAT's spot rates reflect amounts paid by the broker to the carrier. (The Trucker, 2026)
- → $524 At 6 miles per gallon and 500 miles a day, DAT figures diesel cost about $524 per day in September 2026, against $310 in February. (DAT Freight & Analytics, 2026)
- → 52 percent Only 52 percent of OOIDA survey respondents said they could include a fuel surcharge in their rate, and the average surcharge was $0.47 per mile. (OOIDA Foundation, 2024)
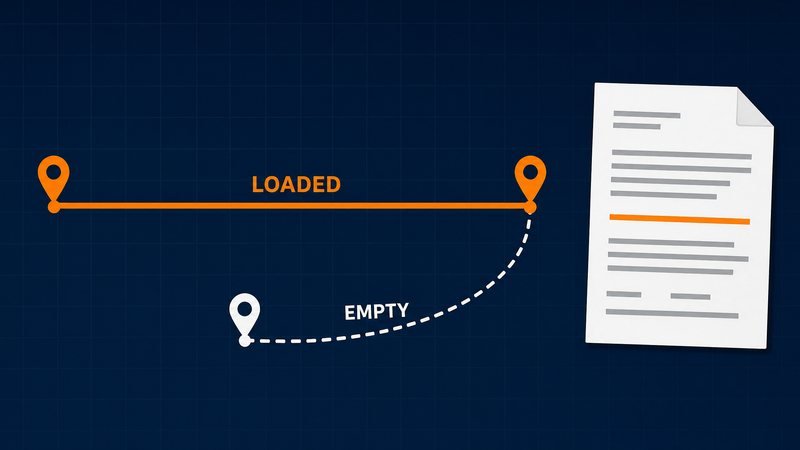
No load board rate is what you get paid. DAT's September 2026 dry van spot average was $3.01 per mile, and it is the closest of the big three to real money, because DAT builds it from invoices of loads that already moved. Truckstop reports what brokers posted. SONAR reports what got booked. Those are three different questions with three different answers, and none of them is your settlement.
The gap matters because you plan around these numbers. If the math is new to you, start with how to calculate rate per mile. Then read on to see what each benchmark counts, why one month shows different rates, and how a rate per loaded mile turns into pay per mile you drive. A calculator near the end lets you run your own figures.
1 What Does Each Load Board Rate Count?
DAT counts invoices, so its spot rate is what a broker paid a carrier. Truckstop reports rates that brokers posted. SONAR counts dry van loads that were booked but not yet invoiced. Only DAT is built from money that changed hands, and it covers hauls of 250 miles or more.
| METRIC | VALUE | SOURCE |
|---|---|---|
| DAT rate source | invoice data | DAT Freight & Analytics |
| DAT spot rate definition | paid by the broker to the carrier | DAT Freight & Analytics |
| DAT haul length covered (volume index) | 250 miles or more | DAT Freight & Analytics |
| Truckstop spot rate source | broker posted | The Trucker |
| Truckstop note on fuel surcharges for spot carriers | typically do not receive surcharges | The Trucker |
| SONAR rate source | booked (not invoiced) | FreightWaves |
| SONAR fuel treatment | includes fuel | FreightWaves |
Think of the three as points in the life of a load. A posted rate is an offer. A booked rate is a deal. An invoiced rate is a deal that closed and got billed. Only the last one tells you what changed hands, which is why DAT's description matters: its rates come from invoice data that shippers, brokers and carriers send from their own systems (DAT Freight & Analytics, 2026).
Fuel adds a second layer. Truckstop's report with FTR notes that carriers in the spot market typically do not receive fuel surcharges, so it uses a calculated surcharge as a stand in to show rates without fuel (The Trucker, 2026). SONAR's index includes fuel too (FreightWaves, 2022).
One more limit. The loads you see on free load boards are posted loads, not paid ones. A posted rate is one broker's offer on one day. Treat it as the start of the phone call, not a promise. If a term here is new to you, the trucking glossary explains it.
2 Why Do Benchmarks Show Different Rates in the Same Month?
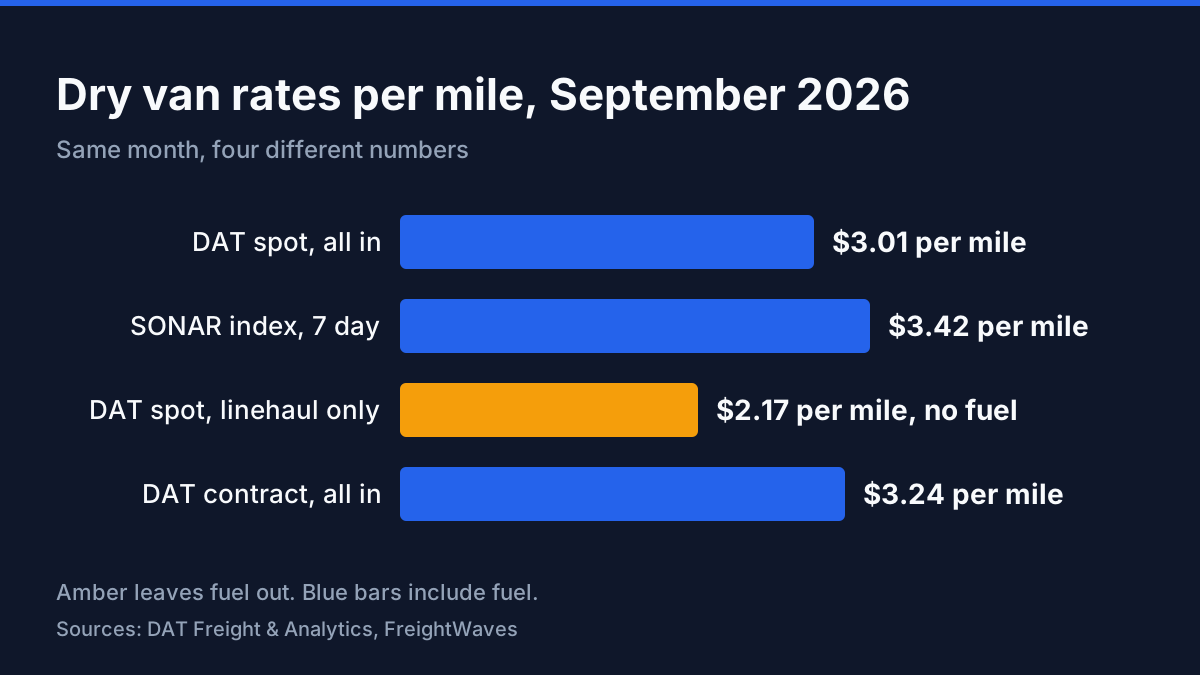
In September 2026, DAT's all in dry van spot average was $3.01 per mile, while SONAR read $3.42 on September 16. That is a gap of about forty one cents. Part of it is timing and part is definition, and no source splits it exactly.
| METRIC | VALUE | SOURCE |
|---|---|---|
| DAT dry van spot, all in | $3.01 | DAT Freight & Analytics |
| SONAR National Truckload Index, dry van, seven day | $3.42 | FreightWaves |
| DAT dry van spot, linehaul only | $2.17 | DAT Freight & Analytics |
| DAT dry van contract, all in | $3.24 | DAT Freight & Analytics |
Start with the window. DAT's figure is a monthly average, and SONAR's is a seven day moving average read on one day (FreightWaves, 2026). When prices move fast, a one day reading can sit well away from a month average. September was a volatile month for fuel, with the average on highway diesel price at $6.291 per gallon, the first monthly average above six dollars (DAT Freight & Analytics, 2026).
Then look at what is inside each number. Both include fuel. DAT also publishes the linehaul alone, which was $2.17 per mile. If someone quotes you a rate and you cannot tell whether fuel is in it, you cannot compare it to anything.
Contract is a third level. DAT put dry van contract at $3.24 per mile for the month, above its spot figure. Contract rates are set ahead of time with shippers, so they sit apart from the day to day spot market.
The spread between what a shipper pays and what a carrier gets also depends on the broker. For how big that cut tends to run, read what percent freight brokers keep. To see live postings next to these benchmarks, check our loads and rates page.
3 Do the Benchmarks at Least Agree on Direction?
Yes. All three show rates well above last year. DAT's September dry van spot rate rose 96 cents per mile from September 2025, Truckstop's weekly read was up 43% year over year, and SONAR was up 47%. They differ on the size of the move, not the direction.
| METRIC | VALUE | SOURCE |
|---|---|---|
| DAT dry van spot, change from September 2025 | 96 cents | DAT Freight & Analytics |
| Truckstop dry van spot, year over year, week ended September 11 | 43% | The Trucker |
| SONAR National Truckload Index, year over year, September 16 | 47% | FreightWaves |
That is useful. If you only need to know whether the market is up or down, any of the three will do. A carrier who sees all three pointing up can trust that rates did rise.
The sizes differ because the bases differ. You cannot set 96 cents next to 43% and call it a match, because one is cents on a monthly average and the other is a percent change on a single week. Weekly and daily reads also bounce more than a monthly average does.
Year over year gains also depend on how weak last year was. A large percent gain off a low base still leaves you with a rate, in dollars, that has to cover your costs. That is where the next two sections start.
4 What Do Carriers Say They Actually Get Paid?
OOIDA's 2024 survey drew 1,023 responses. It put average pay for owner operators with their own authority at $2.45 per mile, and $2.22 across all respondents. The same survey found an average operating cost of $2.00 per mile. These are survey answers from a sample, not settlement data.
| METRIC | VALUE | SOURCE |
|---|---|---|
| Pay per mile, owner operators with own authority (2024) | $2.45 | OOIDA Foundation |
| Pay per mile, all respondents (2024) | $2.22 | OOIDA Foundation |
| Operating cost per mile reported by respondents (2024) | $2.00 | OOIDA Foundation |
| Respondents able to add a fuel surcharge (2024) | 52% | OOIDA Foundation |
| Average fuel surcharge among those who could add one (2024) | $0.47 | OOIDA Foundation |
| Extra pay per mile for owner operators who knew their cost (2024) | $0.26 | OOIDA Foundation |
It is tempting to set $2.45 next to DAT's $3.01 and say carriers are short by about fifty six cents. Do not. The pay figure is for 2024 and the DAT figure is for 2026. The survey is also a sample: only a small share of the members OOIDA emailed answered, and the answers are self reported (OOIDA Foundation, 2024).
What the survey does show is how thin the margin can run. Pay of $2.45 against a cost of $2.00 leaves about forty five cents a mile, before taxes. That is a calculation from the two survey figures, not a number OOIDA published.
One finding stands out. Owner operators who knew their cost of operations reported $0.26 more per mile than those who did not. The survey does not prove that knowing your cost causes higher pay. It does fit a simple point: a driver who knows the floor can say no to a load below it.
For what is left after the full list of costs, see owner operator salary after expenses.
5 How Do Empty Miles Change a Loaded Mile Rate?
A load rate pays for the miles on the load, but you also drive empty miles to reach it. OOIDA's 2022 survey put deadhead, which is miles you drive empty, at 17 percent of all miles. Your costs run on every mile you drive, empty or loaded.
| METRIC | VALUE | SOURCE |
|---|---|---|
| Deadhead share of all miles, owner operators (2022 survey) | 17 percent | OOIDA |
| Industry average cost to operate a truck, 2025 | $2.336 | American Transportation Research Institute |
| Cost to operate a truck excluding fuel, 2025 | $1.854 | American Transportation Research Institute |
| DAT dry van spot, all in, September 2026 | $3.01 | DAT Freight & Analytics |
Here is the math with sourced numbers. Take DAT's $3.01 and assume your empty share matches OOIDA's 17 percent. You are paid on eighty three of every hundred miles, so revenue works out to about two dollars and fifty cents per mile driven. Against ATRI's $2.336, which I treat as a cost per mile driven, that leaves about sixteen cents. Those last two figures are my calculation from the sourced numbers.
Treat that as a rough check, not a forecast. ATRI's average covers fleets and predates the September diesel jump (American Transportation Research Institute, 2025), and your own empty share may be far from 17 percent.
Flip the math to find the rate you need. Divide your cost per total mile by the share of miles that are loaded. At $2.336 and 17 percent empty, that is about two dollars and eighty one cents per loaded mile. If an offer includes fuel and sits below your own version of that number, it loses money before taxes.
Your own empty share is what counts. Pull your last three months of settlements, add up the empty miles and divide by total miles. A lane with steady backhauls may beat 17 percent, and a one way lane may be much worse. To test one load at a time, use the load profit calculator.
6 Does the Rate Include Fuel Money You Keep?
Check the label. A rate marked all in already holds fuel. DAT estimated 84 cents per mile of its $3.01 September rate was a fuel surcharge share, which leaves $2.17 of linehaul. Spot carriers typically do not receive a separate surcharge, and only 52% of OOIDA respondents could add one.
| METRIC | VALUE | SOURCE |
|---|---|---|
| DAT dry van spot, linehaul only, September 2026 | $2.17 | DAT Freight & Analytics |
| DAT estimate of fuel surcharge inside the spot rate | 84 cents | DAT Freight & Analytics |
| Diesel cost per day, September 2026 (six miles per gallon, five hundred miles) | $524 | DAT Freight & Analytics |
| Diesel cost per day, February 2026 (six miles per gallon, five hundred miles) | $310 | DAT Freight & Analytics |
| Average on highway diesel price, September 2026 | $6.291 | DAT Freight & Analytics |
| Respondents able to add a fuel surcharge (2024) | 52% | OOIDA Foundation |
| Average surcharge among those who could add one (2024) | $0.47 | OOIDA Foundation |
Fuel is where a rate and a paycheck drift apart. At six miles per gallon and five hundred miles a day, DAT figures diesel at $524 a day in September against $310 in February (DAT Freight & Analytics, 2026). A rate quoted before that jump can look fine on paper and thin at the pump.
Read three labels before you compare any two numbers. Does the rate include fuel? Is it per loaded mile or per total mile? Is it posted, booked or paid? Those three questions explain most of the gaps in this article.
To see what fuel costs on your own trips, use the trucking fuel cost calculator. For how past diesel swings hit budgets, see our post on diesel prices.
My verdict: use the benchmarks to see direction, treat a posted rate as an opening offer, and let your own cost per mile make the call. That fits owner operators who book spot freight. It fits less well if you run a dedicated lane with steady backhauls, where your empty share could sit well under the average. Run your own figures in the cost per mile calculator.
Turn a Loaded Mile Rate Into Pay Per Mile Driven
About These Numbers
This article compares published benchmark definitions and survey results as of October 19, 2026. Rates come from DAT, the FreightWaves SONAR National Truckload Index and the Truckstop and FTR weekly report. Carrier pay and empty mile shares come from OOIDA surveys, and cost per mile comes from ATRI. The benchmarks cover different windows and definitions, so the gaps between them are real but not fully explained by any one source. OOIDA results reflect member responses, not every carrier, and ATRI's cost figure is an industry average that predates the September 2026 diesel jump. Calculations marked as mine use only the sourced figures shown.
Frequently Asked Questions
Are DAT rates based on posted loads or on what carriers were paid?
DAT says its rates come from invoice data that shippers, brokers and carriers send from their own systems, and its monthly spot figure reflects amounts paid by the broker to the carrier. DAT's September 2026 dry van spot average was $3.01 per mile. (DAT Freight & Analytics, 2026)
Why do Truckstop, DAT and SONAR show different dry van rates?
They count different things. Truckstop reports broker posted rates, DAT reports invoiced payments, and SONAR reports booked spot loads over a seven day window. In September 2026 DAT averaged $3.01 per mile while SONAR read $3.42 on September 16. (FreightWaves, 2026)
How many of my miles will be empty?
OOIDA's 2022 member survey put deadhead at 17 percent of all miles driven. Your own share depends on your lanes and how you book. Check your last three months of settlements and use that number instead of an average. (OOIDA, 2022)
What do owner operators with their own authority report earning per mile?
OOIDA's survey of 1,023 members put average pay for owner operators under their own authority at $2.45 per mile for 2024, down 5 cents from 2023. The same survey found an average operating cost of $2.00 per mile. (OOIDA Foundation, 2024)
Does a spot rate include fuel surcharge money for me?
A rate marked all in already contains fuel, and spot carriers typically do not receive a separate surcharge. In September 2026 DAT estimated an 84 cents per mile fuel surcharge share inside its $3.01 dry van spot rate, and only 52 percent of OOIDA respondents could add one at all. (DAT Freight & Analytics, 2026)
What does it cost to run a truck per mile right now?
ATRI's industry average was $2.336 per mile in 2025, and $1.854 without fuel. That average covers carriers of many types and sizes and predates the September 2026 diesel spike, so your own cost per mile is the number to use. (American Transportation Research Institute, 2025)
Sources & References
- DAT Freight & Analytics. "DAT: Truckload rates rise in September as diesel tops $6 a gallon." Accessed October 19, 2026.
- FreightWaves. "Trucking Market: Volumes UP, Diesel Soaring. Is Peak Here?." freightwaves.com/news/trucking-market-volumes-up-diesel-soaring-is-peak-here. Accessed October 19, 2026.
- FreightWaves. "FreightWaves releases National Trucking Index to measure domestic truckload market." freightwaves.com/news/freightwaves-releases-national-trucking-index-.... Accessed October 19, 2026.
- The Trucker. "Truckstop, FTR: Van spot rates rise modestly as fuel prices surge." thetrucker.com/trucking-news/business/truckstop-ftr-van-spot-rates-rise-modestly. Accessed October 19, 2026.
- OOIDA Foundation. "2025 Freight Rate Survey (2024 data)." ooida.com/wp-content/uploads/2025/01/2024-Freight-Rate-Survey-Final-Report.pdf. Accessed October 19, 2026.
- OOIDA. "2022 Owner Operator Member Profile Survey." ooida.com/wp-content/uploads/2022/05/2022-Owner-Operator-Survey.pdf. Accessed October 19, 2026.
- American Transportation Research Institute. "New ATRI Report Details Accelerating Costs and Low Profitability Despite Cuts." truckingresearch.org/2026/07/new-atri-report-details-accelerating-costs-and-low-. Accessed October 19, 2026.
Last updated: