Owner Operator Profit Per Mile by Trailer Type (2026)
KEY TAKEAWAYS
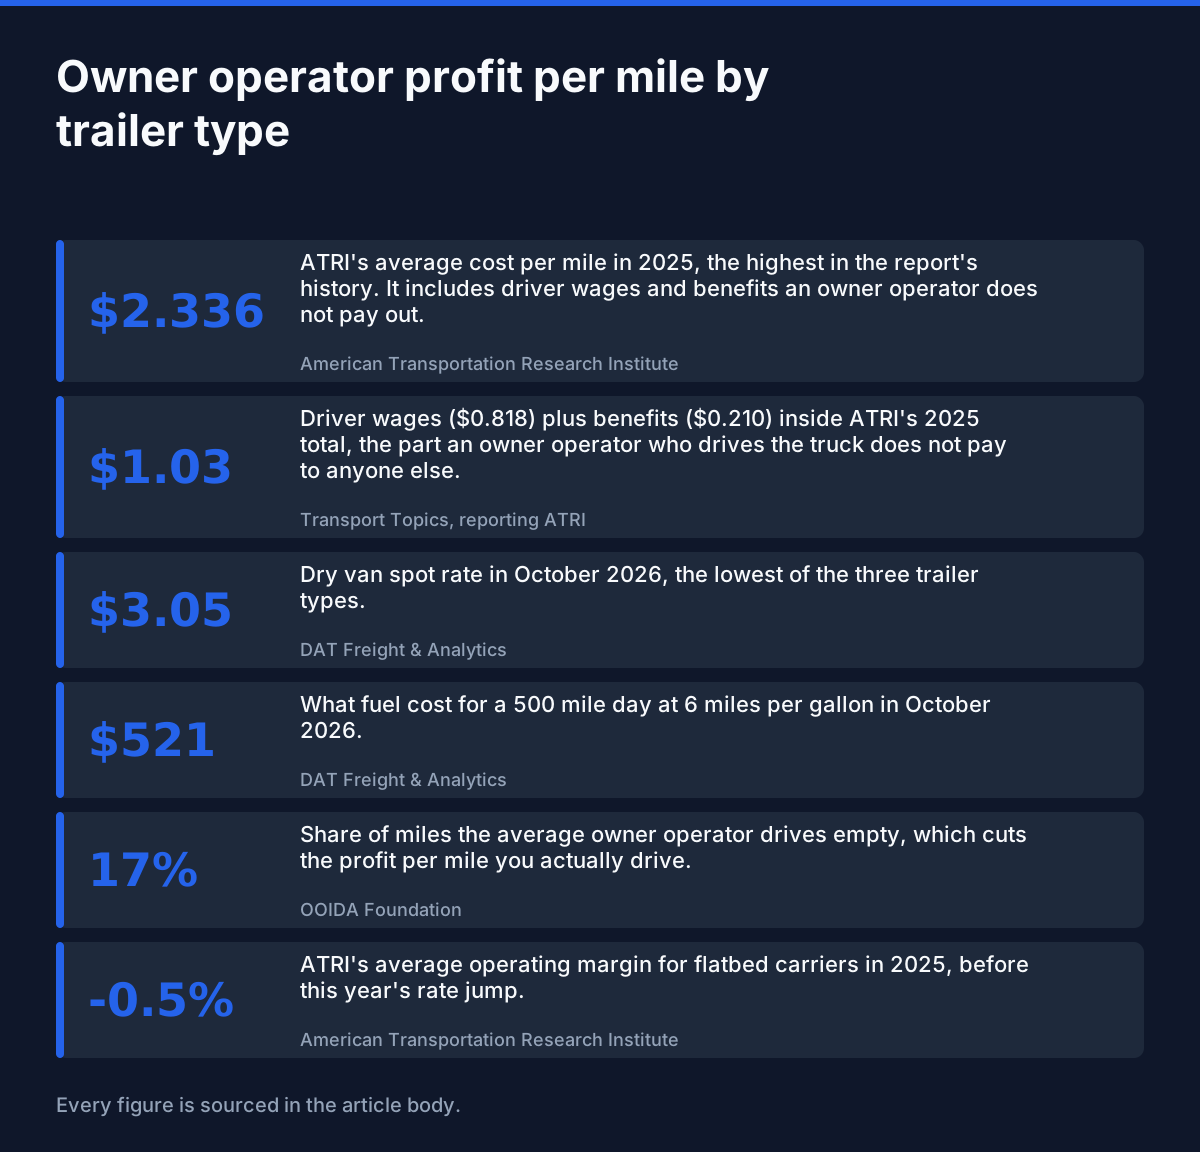
- → $2.336 ATRI's average cost per mile in 2025, the highest in the report's history. It includes driver wages and benefits an owner operator does not pay out. (American Transportation Research Institute, 2025)
- → $1.03 Driver wages ($0.818) plus benefits ($0.210) inside ATRI's 2025 total, the part an owner operator who drives the truck does not pay to anyone else. (Transport Topics, reporting ATRI, 2025)
- → $3.05 Dry van spot rate in October 2026, the lowest of the three trailer types. (DAT Freight & Analytics, 2026)
- → $521 What fuel cost for a 500 mile day at 6 miles per gallon in October 2026. (DAT Freight & Analytics, 2026)
- → 17% Share of miles the average owner operator drives empty, which cuts the profit per mile you actually drive. (OOIDA Foundation, 2021)
- → -0.5% ATRI's average operating margin for flatbed carriers in 2025, before this year's rate jump. (American Transportation Research Institute, 2025)
Most owner operators check a rate against one cost number, and that number is usually wrong for them. The figure that gets passed around is $2.336 a mile, from the American Transportation Research Institute (ATRI). (American Transportation Research Institute, 2025)
That total pays a driver. About $0.818 a mile is driver wages and $0.210 is driver benefits. (Transport Topics, reporting ATRI, 2025) If you are the one driving, you are not writing that check to someone else, so using the full number makes every load look worse than it is.
This page fixes that. I take the freight rates DAT reported for October 2026, subtract a cost per mile built for an owner operator who drives their own truck, and show what is left on dry van, reefer and flatbed. Then I take out the empty miles, because that is where most of the money goes.
This is written for company drivers weighing a truck of their own and for new owner operators who have a truck but not yet a clear break even number. If you already track every line of your settlement, use this as a check against your own figures. If you do not, it gives you a first number to test.
I leased on with Landstar as a BCO and ran under their authority before I got my own. Treat it as a starting point and put your own numbers into the cost per mile calculator before you sign anything.
1 What Does the $2.336 Cost Per Mile Really Include?
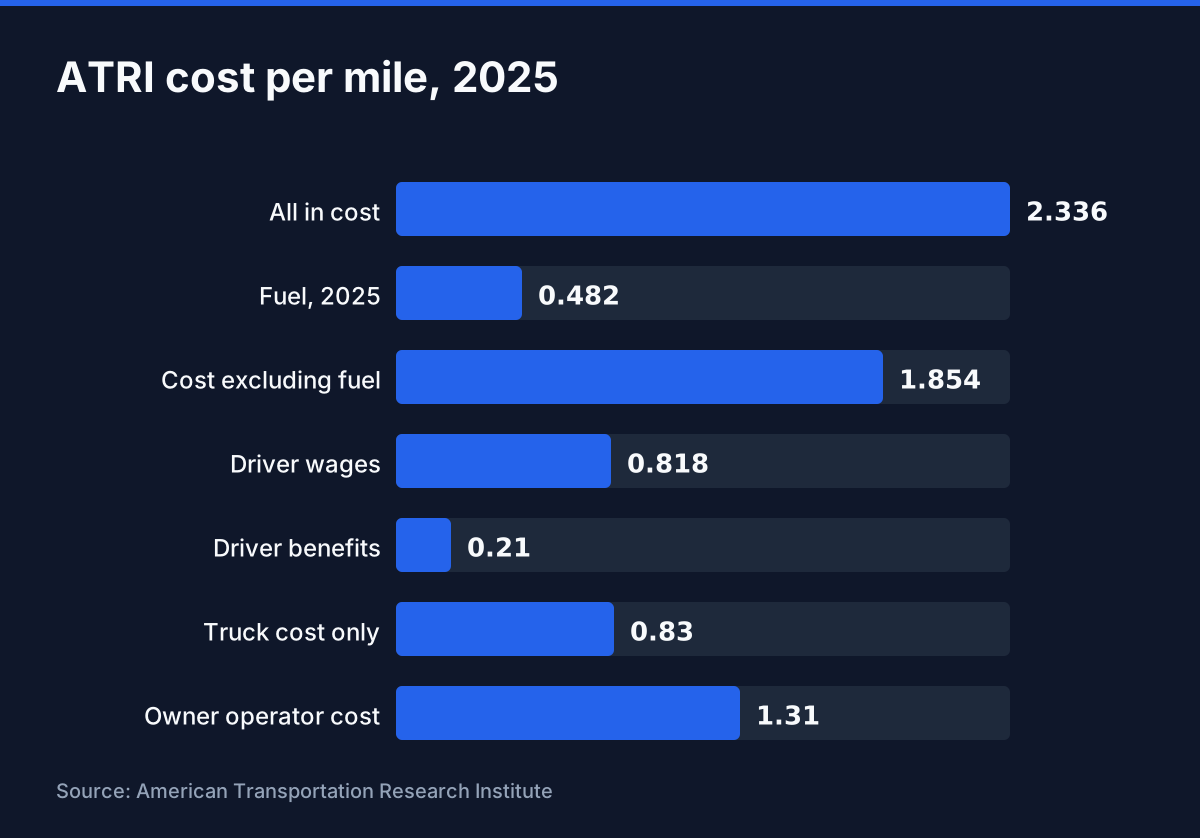
ATRI's $2.336 a mile is an average for fleets that pay drivers. It includes $0.818 for wages and $0.210 for benefits. An owner operator who drives the truck does not pay those to anyone else, so the cost that applies to you is closer to $1.31 with 2025 fuel.
| COST LINE | PER MILE | SOURCE |
|---|---|---|
| All in cost, 2025 | $2.336 | American Transportation Research Institute |
| Cost excluding fuel | $1.854 | American Transportation Research Institute |
| Fuel, 2025 | $0.482 | Calculated from DAT and ATRI figures |
| Driver wages inside the total | $0.818 | Transport Topics, reporting ATRI |
| Driver benefits inside the total | $0.210 | Transport Topics, reporting ATRI |
| Cost without driver pay and fuel | $0.83 | Calculated from DAT and ATRI figures |
| Owner operator cost with 2025 fuel | $1.31 | Calculated from DAT and ATRI figures |
The split matters because most advice on this topic stops at the big number. If a broker offers you a rate and you subtract the full $2.336, you are charging yourself for a driver you did not hire. You still need to pay yourself, but that comes out of what is left, not out of the cost.
Think about what each part of that total pays for. Truck and trailer payments, repairs, insurance, tires and tolls belong to the equipment, so you carry them whether you hire a driver or drive yourself. Driver wages and benefits belong to the person in the seat. When you are that person, they are your paycheck, and they come out of profit. That is why I split the number here instead of treating the whole total as cost.
The wage and benefit lines come from Transport Topics' coverage of the ATRI report. (Transport Topics, reporting ATRI, 2025) Driver wages rose only a little in 2025, and ATRI called driver pay one of just two lines that grew slower than inflation.
If you are working out your own number from scratch, how to calculate rate per mile walks through the lines one at a time.
2 What Did Each Trailer Type Pay in October 2026?
DAT's October 2026 numbers put dry van spot at $3.05 a mile, reefer at $3.60 and flatbed at $3.61. Contract rates were $3.28 for van, $3.62 for reefer and $4.05 for flatbed. All of these include fuel surcharges, so you do not add fuel on top.
| TRAILER TYPE | RATE PER MILE | SOURCE |
|---|---|---|
| Dry van, spot | $3.05 | DAT Freight & Analytics |
| Reefer, spot | $3.60 | DAT Freight & Analytics |
| Flatbed, spot | $3.61 | DAT Freight & Analytics |
| Dry van, contract | $3.28 | DAT Freight & Analytics |
| Reefer, contract | $3.62 | DAT Freight & Analytics |
| Flatbed, contract | $4.05 | DAT Freight & Analytics |
Rates moved a lot in a year. Dry van spot is up 98 cents from a year earlier, reefer is up $1.12 and flatbed is up $1.10. (DAT Freight & Analytics, 2026) Those are big jumps, and they explain why drivers who had a bad 2025 are talking about a better fall.
Spot and contract do not line up the same way on every trailer. Reefer spot and flatbed spot sit within a penny of each other, while flatbed contract pays far above flatbed spot. Contract rates include fuel surcharges, and the spot rates here are all in, so the two are comparable.
The market has not moved much since. In the week that ended on the ninth of November, DAT's all in spot rates were $3.11 for van, $3.70 for reefer and $3.65 for flatbed, and diesel averaged $6.13 a gallon. (Overdrive, reporting DAT, 2026) Fuel is close to what the October numbers assumed, so the math below still holds.
Do not read a national average as your rate. Your lanes decide it. Load board rate accuracy explains why the posted number and the paid number often differ.
3 How Much Is Left Per Loaded Mile After Costs?
I use $1.87 a mile as the owner operator cost: $0.83 for the truck plus $1.04 for fuel at October 2026 prices. Take that from each rate and dry van spot leaves $1.18 a loaded mile, reefer spot $1.73 and flatbed spot $1.74. Flatbed contract leaves $2.18.
| TRAILER TYPE AND MARKET | LEFT PER LOADED MILE | SOURCE |
|---|---|---|
| Dry van, spot | $1.18 | Calculated from DAT and ATRI figures |
| Reefer, spot | $1.73 | Calculated from DAT and ATRI figures |
| Flatbed, spot | $1.74 | Calculated from DAT and ATRI figures |
| Dry van, contract | $1.41 | Calculated from DAT and ATRI figures |
| Reefer, contract | $1.75 | Calculated from DAT and ATRI figures |
| Flatbed, contract | $2.18 | Calculated from DAT and ATRI figures |
Here is a worked example for dry van spot. The rate is $3.05 a mile. Take off the owner operator cost of $1.87 and you have $1.18 a loaded mile. For flatbed contract the rate is $4.05, so the same cost leaves $2.18. The only thing that changed between those two loads is the rate, because I held the cost steady.
Fuel is the part of this math that moved most. DAT worked out that a five hundred mile day at six miles per gallon cost $521 in October. (DAT Freight & Analytics, 2026) I turned that into a per mile figure of $1.04. If your truck gets better mileage, your number is lower, and you can test that in the fuel cost calculator.
Here is the part to be careful with. These figures are before taxes and before you pay yourself, and they use one cost number for every trailer. A reefer carries a fuel burning refrigeration unit and a flatbed carries tarps and straps, so real costs differ by trailer. ATRI does not publish a cost per mile split by trailer type, which is why I applied one number to all three.
That means the gaps between trailers in this table come only from the rates. Use your own cost per mile in place of mine and the gaps will shift.
4 What Do Empty Miles Do to Profit Per Mile?
A rate is paid on loaded miles, but you also drive empty ones. OOIDA's survey found 17% of owner operator miles run empty. After that, dry van spot leaves $0.66 a mile driven, reefer spot $1.12 and flatbed spot $1.13. Flatbed contract leaves $1.49.
| TRAILER TYPE AND MARKET | LEFT PER MILE DRIVEN | SOURCE |
|---|---|---|
| Dry van, spot | $0.66 | Calculated from DAT and ATRI figures |
| Reefer, spot | $1.12 | Calculated from DAT and ATRI figures |
| Flatbed, spot | $1.13 | Calculated from DAT and ATRI figures |
| Dry van, contract | $0.85 | Calculated from DAT and ATRI figures |
| Reefer, contract | $1.14 | Calculated from DAT and ATRI figures |
| Flatbed, contract | $1.49 | Calculated from DAT and ATRI figures |
The method is simple. Multiply the rate by the share of miles that are loaded, then take off the same cost per mile. Dry van spot shows how big the hit is: $1.18 per loaded mile becomes $0.66 per mile driven.
Run the same example with empty miles. Dry van spot pays $3.05 on the loaded mile, but you only collect that on the share of miles that are loaded. Your cost, $1.87, applies to every mile you drive. That is how $1.18 on paper turns into $0.66 in practice, and the difference is paid for with fuel, tires and wear on a truck with no freight in the trailer.
The empty mile figure comes from a 2022 OOIDA survey of owner operators, which covered the year before. (OOIDA Foundation, 2021) It covers all owner operators, not one trailer type. A van driver in a busy lane may deadhead less than this. A flatbed driver who hauls steel one way and comes back empty may deadhead more. Use your own trip log to replace it.
Cutting empty miles is worth more than a small rate bump. A better lane, a backhaul or a good broker relationship all move this number, and how to get better rates from freight brokers covers the broker side.
5 What Does That Mean Per Week, and Which Trailer Fits You?
At about two thousand miles driven in a week, dry van spot leaves $1,327, reefer spot $2,240 and flatbed spot $2,257. On contract, van leaves $1,709, reefer $2,273 and flatbed $2,987. These are before income tax and before you pay yourself.
| TRAILER TYPE AND MARKET | WEEKLY, ABOUT TWO THOUSAND MILES | SOURCE |
|---|---|---|
| Dry van, spot | $1,327 | Calculated from DAT and ATRI figures |
| Reefer, spot | $2,240 | Calculated from DAT and ATRI figures |
| Flatbed, spot | $2,257 | Calculated from DAT and ATRI figures |
| Dry van, contract | $1,709 | Calculated from DAT and ATRI figures |
| Reefer, contract | $2,273 | Calculated from DAT and ATRI figures |
| Flatbed, contract | $2,987 | Calculated from DAT and ATRI figures |
Here is my read. If you are new and have no steady freight, dry van spot is the easiest place to start, but it leaves the least. Reefer and flatbed spot leave about the same per mile, so pick the one your equipment and your lanes support. Flatbed contract leaves the most, and it is the hardest to land.
Do not read flatbed as an easy win. ATRI found the average flatbed carrier ran an operating margin of -0.5% in 2025, and truckload and refrigerated carriers ran below 1.0%. (American Transportation Research Institute, 2025) Higher rates this year have to cover tarps, securement, slower loading and the years of thin margins first.
Who should skip this advice? A driver leased to a carrier that pays a fixed percentage of the load and charges back fuel, insurance and fees will not see these numbers on a settlement, because the carrier sets the split. If that is you, read the settlement line by line and compare it to the rate the load paid, and treat the figures here as the upper limit of what the truck can leave.
Who should lean on it? A new owner operator on their own authority, booking freight directly or through brokers, controls both the rate and the cost. That driver can use the table to decide which rate to accept, which lane to avoid and when a load is not worth the empty miles that follow it.
What would change my view: a van contract with a shipper who keeps you loaded, a reefer lane with a steady backhaul, or a flatbed rate that falls back toward spot. Check the terms on any contract first, and if you are leased to a carrier, lease on carrier terms shows which clauses take money out of these numbers.
Repairs can erase a margin like this faster than any rate swing. My first truck was financed, and I bought it in Houston. A pre purchase inspection that cost five hundred dollars did not catch the problems. The engine failed about eight months later and needed a rebuild. The turbo and the radiator went about three months after that, and I let the truck go. Plan for repairs before you plan for the payment.
Insurance, the truck payment and repairs are inside the cost I used, but your own quotes will differ. Semi truck insurance cost and how much a semi truck costs help you replace my average with your actual figures.
Then put a real load through the load profit calculator before you say yes. A model gets you in the right range. Your settlement tells you the truth.
Explore every figure in this article
Frequently Asked Questions
How much profit per mile can an owner operator make in 2026?
Using DAT's October 2026 rates and ATRI's 2025 costs with 2026 diesel, a dry van on the spot market leaves about $1.18 per loaded mile and flatbed on contract about $2.18, before taxes. After the 17% of miles OOIDA says run empty, those fall to about $0.66 and $1.49 per mile driven. (DAT Freight & Analytics, 2026)
Which trailer type makes the most per mile right now?
In DAT's October 2026 data, flatbed contract freight paid $4.05 a mile, the highest of any type. Reefer and flatbed spot rates, at $3.60 and $3.61, sit within a penny of each other and about 55 cents above dry van spot at $3.05. (DAT Freight & Analytics, 2026)
Why not just subtract ATRI's $2.336 from my rate?
ATRI's $2.336 per mile covers fleets that pay drivers. About $1.03 of it is driver wages and benefits. An owner operator who drives the truck keeps that money as pay, so subtracting the full figure understates what the truck leaves you by roughly a dollar a mile. (Transport Topics, reporting ATRI, 2025)
How much do empty miles cost an owner operator?
OOIDA's survey found 17% of an owner operator's miles run empty. At October 2026 dry van spot rates, that drops the revenue you earn on each mile driven from $3.05 to about $2.53, which is why $0.66 a mile is left after costs instead of $1.18. (OOIDA Foundation, 2021)
Is flatbed really more profitable than dry van?
On 2026 rates it pays more, with flatbed spot at $3.61 against $3.05 for van. But ATRI found flatbed carriers ran an average operating loss of 0.5% in 2025. Higher rates have to cover tarps, securement and slower loading before the extra money is yours. (American Transportation Research Institute, 2025)
What does it cost to run an owner operator truck per mile?
ATRI's 2025 average is $2.336 per mile, with fuel at 48.2 cents. Taking out driver wages and benefits and swapping in October 2026 fuel at about $1.04 a mile gives roughly $1.87 per mile for an owner operator, before the cost of your own pay. (American Transportation Research Institute, 2025)
Sources & References
- American Transportation Research Institute. "New ATRI Report Details Accelerating Costs and Low Profitability Despite Cuts." truckingresearch.org/2026/07/new-atri-report-details-accelerating-costs-and-low-. Accessed 2026-11-14.
- Transport Topics, reporting ATRI. "Truck operating costs rose 3.4% in 2025, ATRI finds." ttnews.com/articles/atri-truck-costs-2025. Accessed 2026-11-14.
- OOIDA Foundation. "2022 Owner-Operator Survey." ooida.com/wp-content/uploads/2022/05/2022-Owner-Operator-Survey.pdf. Accessed 2026-11-14.
- Overdrive, reporting DAT. "Van, reefer rates rebound, fuel prices fall to $6.13/gal. average." overdriveonline.com/business/article/16425119/van-reefer-rates-rebound-fuel-pric. Accessed 2026-11-14.
Last updated: