Owner Operator Miles Per Year: Loaded, Empty & Total by Authority (2026)
KEY TAKEAWAYS
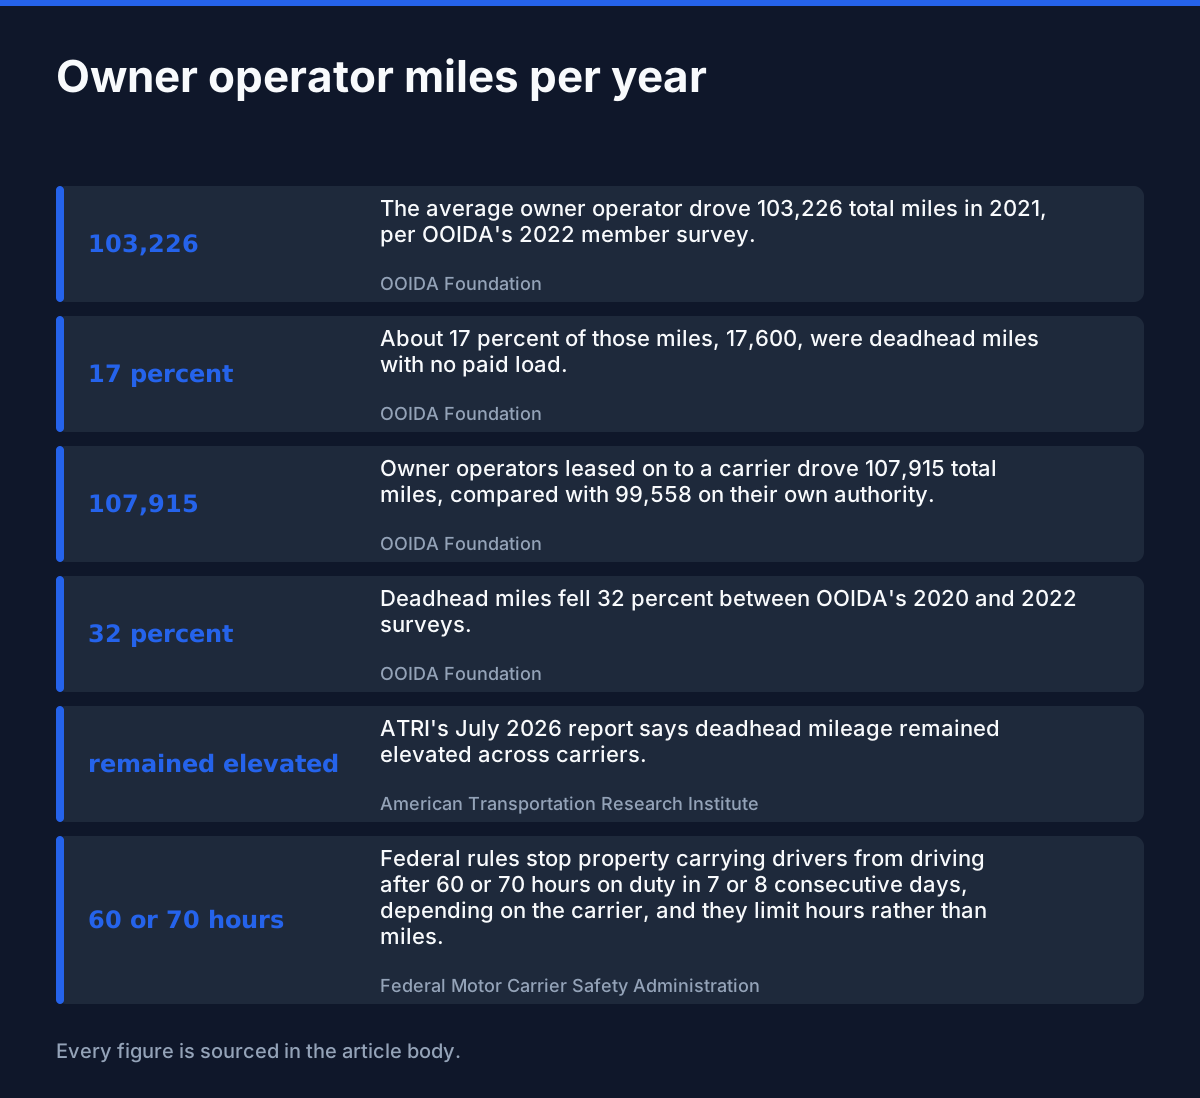
- → 103,226 The average owner operator drove 103,226 total miles in 2021, per OOIDA's 2022 member survey. (OOIDA Foundation, 2021)
- → 17 percent About 17 percent of those miles, 17,600, were deadhead miles with no paid load. (OOIDA Foundation, 2021)
- → 107,915 Owner operators leased on to a carrier drove 107,915 total miles, compared with 99,558 on their own authority. (OOIDA Foundation, 2021)
- → 32 percent Deadhead miles fell 32 percent between OOIDA's 2020 and 2022 surveys. (OOIDA Foundation, 2021)
- → remained elevated ATRI's July 2026 report says deadhead mileage remained elevated across carriers. (American Transportation Research Institute, 2026)
- → 60 or 70 hours Federal rules stop property carrying drivers from driving after 60 or 70 hours on duty in 7 or 8 consecutive days, depending on the carrier, and they limit hours rather than miles. (Federal Motor Carrier Safety Administration, 2026)

In the most recent Owner Operator Independent Drivers Association (OOIDA) member survey with a mileage breakdown, owner operators averaged 103,226 miles in a year. About 17 percent of those miles were deadhead, which means miles you drive empty with no paid load. (OOIDA Foundation, 2021)
That survey is the best public count of owner operator miles I could find, and it has limits. It asks about the year before it was taken, which puts the miles in 2021. It comes from a few hundred member responses, and it does not split miles by trailer type or by weeks worked. The American Transportation Research Institute (ATRI) has newer data, but it describes carrier fleets, not owner operators. ATRI put the fleet average at 85,991 miles per truck for 2025. (American Transportation Research Institute, 2025)
This page lays out both sets of numbers, shows where owner operators on their own authority differ from those leased on to a carrier, and marks what no public source can tell you yet. If you are still sorting out the basics, start with what an owner operator is and come back.
1 How Many Miles Does an Owner Operator Drive in a Year? About 103,000
In OOIDA's 2022 survey, owner operators averaged 103,226 total miles, with 85,626 loaded and 17,600 empty. Loaded miles had a median of 86,000. ATRI shows carrier fleets at 85,991 miles per truck, which is a different group, so compare the two with care.
| METRIC | VALUE | SOURCE |
|---|---|---|
| Average total miles per owner operator | 103,226 | OOIDA Foundation |
| Average loaded miles per owner operator | 85,626 | OOIDA Foundation |
| Median loaded miles per owner operator | 86,000 | OOIDA Foundation |
| Carrier fleet average miles per truck, 2025 | 85,991 | American Transportation Research Institute |
| Carrier fleet average miles per truck, earlier figure in the same report | 82,677 | American Transportation Research Institute |
The loaded average of 85,626 miles and the median of 86,000 miles sit close together. That tells you a few unusually busy or idle trucks are not distorting the loaded average. Total miles are what wear a truck out, so track both numbers.
The ATRI figure looks lower than the OOIDA figure, but the two do not measure the same thing. ATRI averages across carrier fleets, which can include trucks with very different duty cycles. OOIDA asks owner operators how far they ran. Subtracting one from the other would not give you a real gap.
Use the fleet number as a sanity check. Miles drive your income, and they also drive your costs, as the breakdown in owner operator salary after expenses shows. If your own total sits far from both numbers, find out why before you plan around it.
One gap matters here. I found no public source that gives owner operator miles by trailer type. A dry van driver, a reefer driver, a flatbed driver and a hotshot driver run different lanes and wait through different loading times, so one national average hides real differences. If you pull a specialty trailer, use these numbers only as a starting point.
The survey also does not say how many weeks each owner operator worked. For that reason I will not turn the yearly total into a weekly figure. Doing that would mean guessing.
To find your own yearly total, you do not need new software. Add up the loaded miles on your settlement statements, then compare that sum with the total miles on your electronic logging device (ELD) or fuel tax records. The difference is your empty miles. Do this for a full year if you can, because a single strong or weak month can mislead you.
2 How Many of Those Miles Run Empty? About 17 Percent
Owner operators in the OOIDA survey averaged 17,600 deadhead miles, which is 17 percent of all miles. The median was 12,000, well below the average. An earlier survey put the share at 21 percent. ATRI says deadhead mileage for carriers remained elevated.
| METRIC | VALUE | SOURCE |
|---|---|---|
| Average deadhead miles per owner operator | 17,600 | OOIDA Foundation |
| Median deadhead miles per owner operator | 12,000 | OOIDA Foundation |
| Deadhead share of all miles | 17 percent | OOIDA Foundation |
| Deadhead share in the earlier OOIDA survey | 21 percent | OOIDA Foundation |
| Carrier deadhead mileage trend, ATRI | remained elevated | American Transportation Research Institute |
Deadhead is a plain idea with a messy measure. Ask two owner operators what counts as empty and you may get two answers. Some count the run to the pickup, and some count only the miles after a drop with no load booked. Pick one rule, use it every time, and only then compare your number to the survey.
The median of 12,000 miles sits far below the average of 17,600 miles. That gap usually means a smaller group of trucks runs a lot of empty miles and pulls the average up. If your empty miles sit near the median, you are in the middle of this sample. If they sit near the average, look at where your freight network breaks down.
Empty miles usually come from three places. The first is the run to a pickup after you drop a load. The second is repositioning out of a market where little freight leaves. The third is the trip home. You can fix the first with better load planning, you can sometimes fix the second by choosing lanes with balanced freight, and you may need to accept the third.
You will see a rule that deadhead should stay under ten to fifteen percent. I could not trace it to a primary source. Dispatch services and short videos repeat it with no study behind it. The OOIDA average of 17 percent sits above that range and comes from a real survey, so the rule is a talking point with no data behind it.
Empty miles still cost you fuel, tires and wear. Multiply your empty miles by your cost per mile, which the cost per mile calculator finds, and you see what deadhead costs in dollars. Then read how to calculate rate per mile so you judge each rate by loaded miles and by total miles.
3 Own Authority or Leased On: Who Runs More Miles?
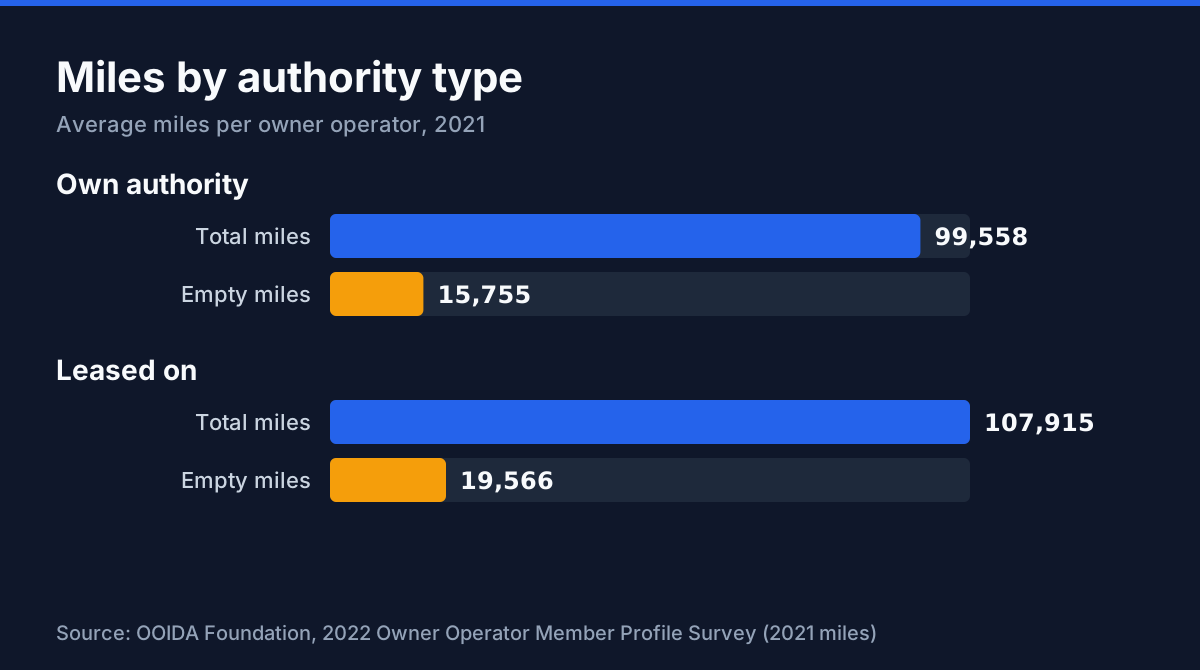
Owner operators leased on to a carrier ran more of every kind of mile. Total miles were 107,915 leased on and 99,558 on their own authority. Loaded miles were 88,349 against 83,803. Deadhead miles were 19,566 against 15,755. The survey does not print a sample size for each group.
| METRIC | VALUE | SOURCE |
|---|---|---|
| Total miles, own authority | 99,558 | OOIDA Foundation |
| Total miles, leased on | 107,915 | OOIDA Foundation |
| Loaded miles, own authority | 83,803 | OOIDA Foundation |
| Loaded miles, leased on | 88,349 | OOIDA Foundation |
| Deadhead miles, own authority | 15,755 | OOIDA Foundation |
| Deadhead miles, leased on | 19,566 | OOIDA Foundation |
Leased on drivers ran more total miles, more loaded miles and more empty miles. The survey does not say why. A carrier's dispatch may keep a leased on truck moving more often, and it may also send that truck on longer repositioning runs. These are guesses, and the survey does not test them.
I divided the survey figures myself. Empty miles come to about 16 percent of total miles on own authority and about 18 percent leased on. OOIDA did not print these shares. They come from my division of group averages, so treat them as rough.
If you are weighing a lease, read lease on carrier terms before you sign. Look at how the carrier handles fuel, fees and the cost of empty miles. Our lease on guide walks through the steps. Extra miles only help when the rate after fuel and fees covers them.
Which group fits you? If you want a carrier to find loads and you accept its fees and rules, the leased on figures are the closer yardstick. If you book your own freight, the own authority figures are closer. Neither average says which setup earns more per mile, because the survey reports miles and not pay. Judge a lease by what you keep per mile after fuel and fees.
If you run on your own authority, the weak spot is finding the next load near the drop. Trucking authority explains what you take on when you hold your own. For the booking side, see how to get better rates from freight brokers.
4 What Changed Between the 2020 and 2022 OOIDA Surveys?
OOIDA's 2020 survey put total miles at 121,000 with 26,000 deadhead. The 2022 survey found 103,226 and 17,600. Loaded miles fell 10 percent and deadhead miles fell 32 percent. Owners on their own authority cut deadhead the most, by 44 percent.
| METRIC | VALUE | SOURCE |
|---|---|---|
| Total miles, 2020 survey | 121,000 | OOIDA Foundation |
| Deadhead miles, 2020 survey | 26,000 | OOIDA Foundation |
| Drop in loaded miles between surveys | 10 percent | OOIDA Foundation |
| Drop in deadhead miles between surveys | 32 percent | OOIDA Foundation |
| Drop in deadhead miles, own authority | 44 percent | OOIDA Foundation |
| Drop in deadhead miles, leased on | 15 percent | OOIDA Foundation |
Both surveys describe member trucks in a single year, so I would not call this a trend. The drop in deadhead is large. It may reflect a strong freight market, a change in who answered or a change in how people counted. The surveys cannot separate those causes.
Neither survey prints the calendar year. Each asks about the year before it was taken, so I read them as 2019 miles and 2021 miles. OOIDA's report is also loose about which group the 10 percent and 32 percent drops describe. They match the change in the 2020 survey averages for all owner operators, so I read them as drops for the whole sample.
The direction is still useful. In the earlier survey about 21 percent of miles were empty, and in the later one about 17 percent were. If your own share runs higher than both, look at your lanes before you blame the market. For help judging a rate before you book, see load board rate accuracy.
The drop does not promise lasting improvement. ATRI says carrier deadhead mileage remained elevated. That is carrier data, but it shows empty miles are still a live problem for the industry.
5 Is There a Legal Limit on Miles? The Law Limits Hours
Federal rules limit hours, not miles. The Federal Motor Carrier Safety Administration (FMCSA) allows 11 hours of driving after ten consecutive hours off duty, ends your driving window at the 14th hour after you come on duty, and bars driving after 70 hours on duty in eight consecutive days for carriers that run every day, or 60 hours in seven for carriers that do not.
| METRIC | VALUE | SOURCE |
|---|---|---|
| Maximum driving after ten consecutive hours off duty | 11 hours | Federal Motor Carrier Safety Administration |
| Driving window after coming on duty | 14th hour | Federal Motor Carrier Safety Administration |
| On duty limit over eight consecutive days, carriers that run every day | 70 hours | Federal Motor Carrier Safety Administration |
| On duty limit over seven consecutive days, carriers that do not run every day | 60 hours | Federal Motor Carrier Safety Administration |
| Time off to restart the seven or eight day period | 34 hours | Federal Motor Carrier Safety Administration |
| Driving before a required 30 minute break | 8 cumulative hours | Federal Motor Carrier Safety Administration |
Hours cap what you can drive in a week, and a week caps your year. A driver who sits at docks for hours has fewer driving hours left, so miles fall without any change in the rules. Detention and slow loading can cost you as many miles as empty runs do.
Taking 34 hours off duty in a row resets the seven or eight day clock. Plan restarts around home time and maintenance as well as your hour cap.
The rule text is 49 CFR 395.3, current as of November 2026. It also requires a 30 minute break once you have driven 8 cumulative hours without one.
Keep your own miles by state for fuel tax reports. The IFTA calculator needs total miles and fuel by state, and those same records show your empty share. This is general information from the FMCSA summary and the federal rule text, so confirm the details with the agency before you rely on them.
My verdict: treat the OOIDA figures as a yardstick for your own year. If you are budgeting your first year, build the budget on your own lanes and your own cost per mile, then see how far you land from the survey. Run each load through the load profit calculator before you book it. If you pull a specialty trailer or drive part time, skip the average and track your own first few months instead.
Check Your Own Year Against the Survey
Frequently Asked Questions
How many miles does an owner operator drive in a year?
In OOIDA's 2022 survey, owner operators averaged 103,226 total miles in the prior year, with 85,626 loaded and 17,600 empty. That covers 2021 and about 300 responding trucks, so treat it as a member sample, not a census. ATRI put carrier fleets at 85,991 miles per truck in 2025. (OOIDA Foundation, 2021)
What share of owner operator miles are deadhead?
OOIDA's 2022 survey found 17 percent of owner operator miles were deadhead, down from 21 percent in its 2020 survey. ATRI's July 2026 report says deadhead mileage remained elevated across carriers in 2025. When you compare your own number, count every mile driven without a paid load. (OOIDA Foundation, 2021)
Do leased on owner operators drive more than owner operators on their own authority?
In OOIDA's 2022 survey they did. Leased on owners averaged 107,915 total miles and 19,566 deadhead miles. Owners on their own authority averaged 99,558 total and 15,755 deadhead. The survey does not print a sample size for each group, so treat the gap as a rough signal. (OOIDA Foundation, 2021)
Is there a legal limit on miles per year for an owner operator?
No. Federal rules limit hours, not miles. FMCSA lets a property carrying driver drive 11 hours after 10 consecutive hours off duty and stops driving after 70 hours on duty in 8 consecutive days, or 60 hours in 7 days for carriers that do not run every day, with a 34 hour restart. How many miles those hours add up to depends on speed and traffic. (Federal Motor Carrier Safety Administration, 2026)
How have owner operator miles changed over time?
OOIDA's 2020 survey described the typical owner operator as driving 121,000 miles with 26,000 deadhead. Its 2022 survey found 103,226 total and 17,600 deadhead. Loaded miles fell 10 percent and deadhead miles fell 32 percent between the two, though both are self reported member surveys. (OOIDA Foundation, 2021)
Is the 10 to 15 percent deadhead target a real industry standard?
No primary source for it turned up. Dispatch services and short videos repeat it with no study behind it. The OOIDA surveys found 17 percent deadhead in 2021 and 21 percent in 2019, so the average owner operator in those surveys ran more empty miles than a target under 15 percent allows. (OOIDA Foundation, 2021)
Are there mileage figures by trailer type for owner operators?
Not in the sources found. OOIDA's 2022 survey reports miles by authority type, not by dry van, reefer, flatbed or step deck. ATRI reports carrier fleet averages. If you run a specialized trailer, compare against your own settlement records rather than a general average. (OOIDA Foundation, 2021)
Sources
- OOIDA Foundation. "2022 Owner Operator Member Profile Survey." Published May 2022.
- OOIDA Foundation. "2020 Owner Operator Member Profile Survey." Published September 2020.
- American Transportation Research Institute. "An Analysis of the Operational Costs of Trucking: 2026 Update." Published July 2026.
- American Transportation Research Institute. "New ATRI Report Details Accelerating Costs and Low Profitability Despite Cuts." Published July 15, 2026.
- Federal Motor Carrier Safety Administration. "Summary of Hours of Service Regulations." Page last updated March 2022.
- Electronic Code of Federal Regulations. "49 CFR 395.3, Maximum driving time for property carrying vehicles." Current text as of November 2026.
Last updated:
Want more RigDigest in your Google results? Add us as a preferred source, then check the box next to rigdigest.com.
Make me a preferred source on Google